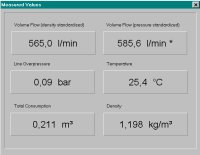

This function shows you
all the measured values registered by the VSM-02
at a glance.
The display is updated about once a second. If all measured values are of interest to
you, then this display is more convenient than having
to check the measured values one after the other on the built-in display of the VSM-02.
To produce a measurement protocol one has to choose a file name, mark the values to be protocolled
and specify the length of the time interval, after which a new set of measured values is to be stored. Click the start
button and from now on the measured values together with date and
time information will be both displayed and written to the protocol file. This continues until the
stop button is pressed. As a matter of course this protocolling can also take place in the background,
so the PC running the VSM-02 software can still be used for other purposes. The resulting file format is
clear and simple and therefore perfectly suited for further processing by standard software like Excel, Lotus-1-2-3 and so on.
In combination with a PC the VSM-02 can be operated at a
higher measurement cycle rate than in standard mode. The
values of flow and pressure are displayed graphically and can
be used to investigate shorter consumption peaks, for instance.
It is possible to record about 10 minutes per sample with a rate of
30-40 measurements/s.
If the measurement cycle rate is reduced, then a recording time of up to 100 minutes is possible, too.
After the recording a
slider allows to scroll the displayed time window (which covers approx. 5 seconds) to any point
of interest. It is also possible to click into the diagram in order to read out the exact value of
consumption peaks, or to mark a region for integration (i.e. to get the amount of liters flown
during this interval). The measured values can also be exported to a file (*.CSV), e.g. for later
evaluation with standard software like Excel.


